Demand-Based Scheduling: How to Match Staffing to Hourly Demand
Demand based scheduling matches staffing to hourly demand using historical sales and traffic data. Learn how to build a staff-to-demand curve and cut labor wast
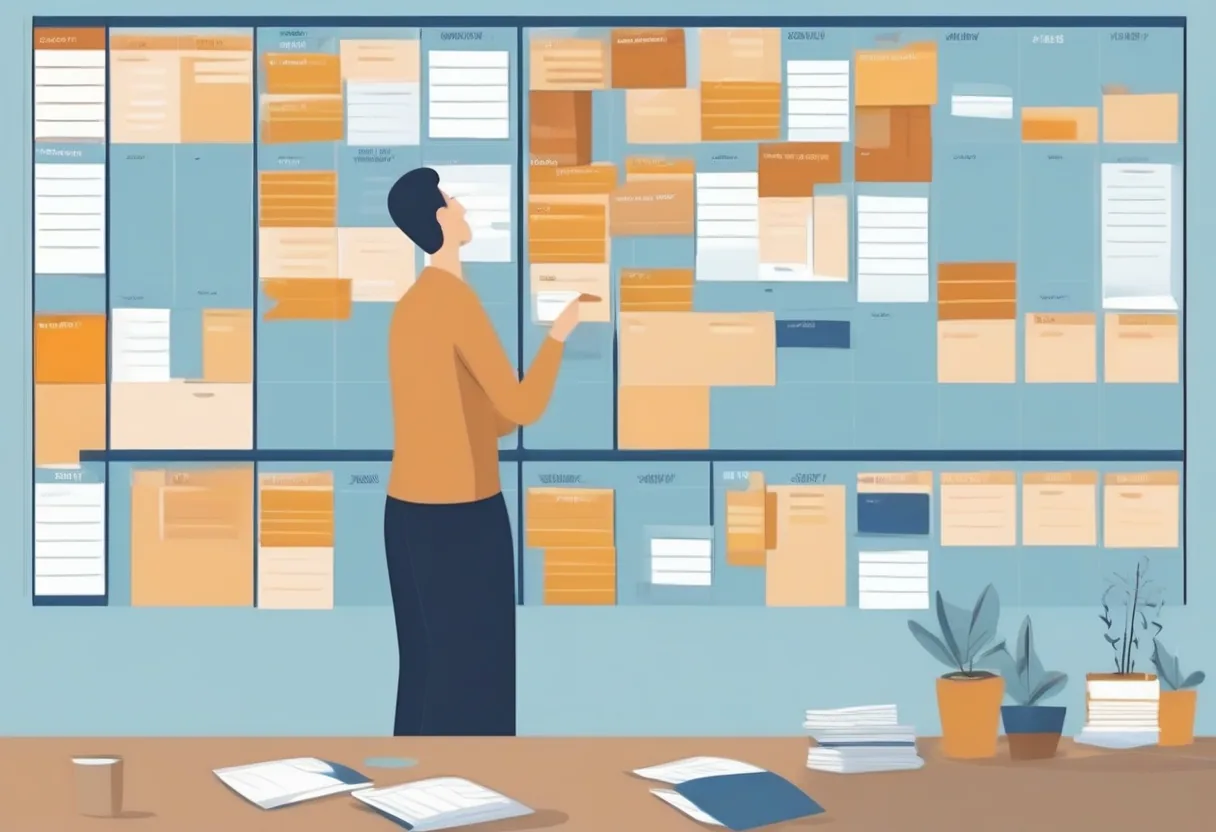
It’s 2:40 on a Tuesday and you have four people standing behind the counter watching the door. Nobody comes in. Then at 6:15 a rush hits, the line backs up to the entrance, two of those same four people clocked out at 5, and the table by the window has been waiting eleven minutes for someone to greet them. You overpaid for the dead afternoon and understaffed the part of the day that actually made money.
That gap — bodies on the clock when there’s nothing to do, and not enough bodies when the work shows up — is what demand based scheduling fixes. Instead of building the week off habit, fairness, or whoever asked for hours first, you build it off the pattern your own business already shows you, hour by hour.
You don’t need a data science team to do this. You need last year’s numbers, a sense of your peaks, and a way to turn that into a schedule people can actually work.
What Is Demand-Based Scheduling?
Demand based scheduling is the practice of setting headcount for each part of the day based on expected demand — sales, transactions, foot traffic, or call volume — rather than on fixed shifts or staff requests. You pull historical data, find the recurring hourly and weekly patterns, then staff up before demand rises and down before it falls, so labor tracks the work instead of the clock.
The result is fewer idle hours, shorter wait times during peaks, and a labor cost that moves in step with revenue. Below, we’ll build the data, the curve, and the ratios that make it repeatable.
Start With the Data You Already Have
You’re sitting on more scheduling intelligence than you think. Your POS, booking system, or even a paper count of customers per hour holds the pattern. The job is to surface it.
Pull the right history
Export the last 8–13 weeks of demand by hour and by day of week. Use whatever metric best represents your actual workload:
- Restaurants/bars: covers or transactions per hour
- Retail: transactions or foot traffic counts per hour
- Hotels: check-ins/check-outs, occupancy, housekeeping room counts
- Clinics/gyms/salons: appointments or check-ins per hour
- Call centers: calls or tickets per interval
Go back far enough to smooth out one weird week, but not so far that a since-changed menu or location skews it. Then layer in the obvious modifiers: paydays, local events, weather sensitivity, holidays, and any seasonal swing you know is coming.
Clean it before you trust it
Strip out the anomalies you can explain — the day the power went out, the one-time private event, the snowstorm that closed the road. An average that includes a freak day will quietly mislead every schedule you build on it. Mark those outliers and exclude them, or note them as known exceptions you’ll plan around separately.
Build Your Staff-to-Demand Curve
Once the data is clean, you’re going to plot it. The staff to demand curve is simply your demand for each hour laid against the number of people it takes to serve that demand well. It turns a spreadsheet into a staffing shape.
Find the pattern
Average each hour across your sample weeks so you get a typical Monday 11am, Monday noon, Monday 1pm, and so on. You’ll usually see the same handful of shapes repeat: a lunch spike, an afternoon trough, a dinner build, a weekend that looks nothing like a Wednesday. That repeating shape is your curve.
Translate demand into bodies
Now decide how much one person can reasonably handle in an hour at your standard of service — call it your coverage unit. If one server comfortably handles 4 tables an hour and you expect 20 occupied tables at 7pm, you need 5 servers on the floor at 7pm. Do that for every hour and you’ve converted demand into a headcount line.
Here’s a simplified illustrative curve for one weekday (your real numbers will differ):
| Hour | Avg demand (covers) | Coverage unit (per person) | Staff needed |
|---|---|---|---|
| 11am | 12 | 6 | 2 |
| 12pm | 30 | 6 | 5 |
| 1pm | 24 | 6 | 4 |
| 3pm | 8 | 6 | 2 |
| 5pm | 18 | 6 | 3 |
| 7pm | 36 | 6 | 6 |
| 9pm | 18 | 6 | 3 |
Notice the schedule isn’t flat. Your shifts shouldn’t be either. The curve tells you to stagger start and end times so people arrive ahead of the build and leave when the work tapers — not all at once on the hour.
Sales-Based Scheduling and the Labor-to-Sales Ratio
Headcount answers “how many.” Sales based scheduling answers “how many can I afford.” The two work together: the curve sets the shape, the budget sets the ceiling.
Set a target labor-to-sales ratio
Labor to sales ratio scheduling ties your wage spend to expected revenue for the same period. The ratio is straightforward:
Labor cost ÷ sales = labor-to-sales ratio
If you target 25% and a Friday dinner is forecast to bring in $4,000, you have roughly $1,000 in wages to spend on that block. That number tells you whether the 6-person curve at 7pm is affordable or whether you trim to 5 and adjust expectations. Healthy ratios vary widely by industry and even by daypart, so set yours from your own P&L, not a number you read online.
Use the ratio as a guardrail, not a hammer
A ratio is a budget, not a rule that overrides reality. If cutting one person to hit a percentage means a 20-minute wait that costs you repeat customers, the “savings” is an illusion. Check your forecast accuracy weekly: compare what you scheduled against what actually happened, and tighten the next build. Over a few cycles your forecasts get noticeably sharper.
Schedule by Foot Traffic, Not by Habit
For retail and any walk-in business, sales can lag the real workload — people browse, ask questions, and need help long before (or without) buying. That’s why it often pays to schedule by foot traffic rather than transactions alone.
Count the doorway, not just the register
A door counter, Wi-Fi pings, or even a manager’s hourly tally captures demand that never rings up but still needs staff. A Saturday with heavy browsing and a so-so conversion rate is still a busy floor. If you only staff to sales, you’ll understaff exactly when service quality decides whether browsers become buyers.
Match arrivals, not the clock
Build start times around when people actually walk in. If your traffic climbs from 11, having everyone start at 9 and fade by mid-afternoon gets it backwards. Stagger shifts so coverage peaks with traffic. For a deeper walk-through of traffic-driven retail builds, see our guide on retail scheduling around foot traffic.
Turn the Curve Into a Workable Schedule
A perfect curve that ignores your people falls apart by Wednesday. Real schedules respect both the data and the humans.
Balance demand against people
Honor availability and time-off requests, watch overtime before it lands, and use rotation patterns so the same people don’t always get stuck with the worst slots. A schedule that’s mathematically efficient but quietly burning out your best staff isn’t efficient for long. When demand spikes unexpectedly, having a clear last-minute call-out and coverage policy keeps a busy hour from turning into a scramble.
A repeatable weekly loop
| Step | What you do | Cadence |
|---|---|---|
| 1. Pull data | Export demand by hour/day | Each cycle |
| 2. Forecast | Apply curve + known modifiers | Weekly |
| 3. Set budget | Apply labor-to-sales target | Weekly |
| 4. Build | Stagger shifts to the curve | Weekly |
| 5. Review | Scheduled vs. actual, adjust | Weekly |
Run this loop a handful of times and it stops feeling like analysis. It becomes the way you schedule. Clear communication matters as much as the math — keep your team in the loop with the practices in our shift-worker communication guide. You’ll find more playbooks in the scheduling hub.
How ShiftSynch helps
ShiftSynch turns scheduling into a repeatable system: organize staff into teams, build shifts with rotation patterns, manage time-off and availability, track qualifications, and export clean reports — all on web and mobile.
Start free — no credit card required (1 team, up to 10 staff); paid plans start at $9/month with a 14-day trial.
Demand based scheduling isn’t a one-time project; it’s a habit of letting your own numbers set your headcount. Start with one busy day, build its curve, and staff to it next week. Once you see the dead hours shrink and the rushes covered, you’ll wonder how you ever scheduled by gut.
Frequently Asked Questions
Q: What is sales based scheduling and how is it different from demand-based scheduling? Sales based scheduling sets staffing levels against forecast revenue for each period, while demand-based scheduling responds to total workload — including foot traffic, calls, or appointments that don’t immediately show up as sales. Sales gives you a budget ceiling; demand gives you the true shape of the work. Most strong schedules use both together.
Q: How do I build a staff-to-demand curve? Export 8–13 weeks of demand by hour and day of week, average each hour to find the typical pattern, then divide expected demand by how much one person handles per hour at your service standard. That gives you a headcount line for every hour. Plot it, stagger shift start and end times to match it, and review actuals weekly.
Q: What is a good labor to sales ratio for scheduling? There’s no universal number — healthy labor-to-sales ratios differ by industry, region, and even daypart. Calculate yours from your own profit-and-loss statements rather than a figure you find online. Use the ratio as a budget guardrail, not an absolute rule, and verify any wage-and-hour requirements with current local regulations.
Q: Why should I schedule by foot traffic instead of sales? Foot traffic captures workload that sales miss — browsers asking questions, returns, and service moments that don’t ring up but still need staff. If you schedule only to transactions, you’ll understaff busy-but-low-conversion periods, exactly when good service turns browsers into buyers. A door counter or hourly tally reveals demand your register alone won’t show.
Frequently Asked Questions
- What is sales based scheduling and how is it different from demand-based scheduling?
- Sales based scheduling sets staffing levels against forecast revenue for each period, while demand-based scheduling responds to total workload — including foot traffic, calls, or appointments that don't immediately show up as sales. Sales gives you a budget ceiling; demand gives you the true shape of the work. Most strong schedules use both together.
- How do I build a staff-to-demand curve?
- Export 8–13 weeks of demand by hour and day of week, average each hour to find the typical pattern, then divide expected demand by how much one person handles per hour at your service standard. That gives you a headcount line for every hour. Plot it, stagger shift start and end times to match it, and review actuals weekly.
- What is a good labor to sales ratio for scheduling?
- There's no universal number — healthy labor-to-sales ratios differ by industry, region, and even daypart. Calculate yours from your own profit-and-loss statements rather than a figure you find online. Use the ratio as a budget guardrail, not an absolute rule, and verify any wage-and-hour requirements with current local regulations.
- Why should I schedule by foot traffic instead of sales?
- Foot traffic captures workload that sales miss — browsers asking questions, returns, and service moments that don't ring up but still need staff. If you schedule only to transactions, you'll understaff busy-but-low-conversion periods, exactly when good service turns browsers into buyers. A door counter or hourly tally reveals demand your register alone won't show.
Ready to replace the spreadsheet and group text?
Build the rotation, publish shifts, and see qualified coverage in ShiftSynch.
Start free